Last week, my friend asked me what does Relative Rotation Graph (RRG) mean and what are the investment implications?
It’s a very good question not because my friend asked me rather, whenever we see any data point this is the basic question one should ask.
Therefore, in this edition I will capture essence of RRG in less than 5 sentences (I will try atleast) and then this week’s sector positioning:
RRG charts are two dimensional charts which capture relative strength of a stock or a sector vs an Index. Theory is, strong sectors (or stocks) keep outperforming on relative basis and vice versa for weak sectors (or stocks).
RRG charts also provide a good way of understanding ‘movement of money’ - sectors which will see inflow will tend to outperform and vice versa.
When we talk of outperformance / underperformance (OP/UP) - one is the ‘quantum’ of performance and second is ’pace’ or rate of change of OP/UP.
Therefore, RRG charts have two axis - one is RS Ratio scale (X-Axis - measure of ’Quantum’) and the other axis is RS Momentum (Y-Axis - measure of ‘Pace’).
Investment implications: For long only portfolios concentrate on Lagging but improving or Leading and Gaining quadrants i.e. top half of the chart. These charts can be volatile at times especially when the index is moving sideways (non-trend market), but that doesn’t reduce the efficacy of the signal.
Hopefully, you find this useful - please reach out if you have any follow up questions on RRG (Methodology details can be found here: https://bit.ly/2YcX7nT)
Back to Business - RRG chart as of 1st Oct, 2021.
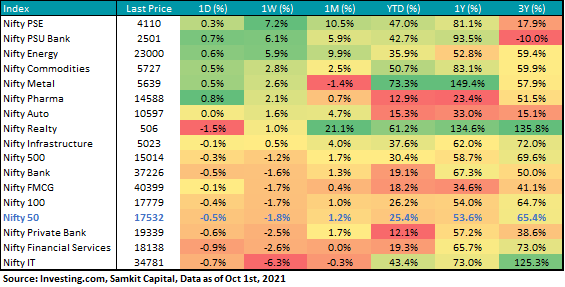
Last week, only three sectors underperformed NIFTY 50 - Banks and IT.
This indicates that there was lot of action in underlying stocks vs the headline index.
Last week, Realty, Energy, Discretionary and IT were the strong sectors - barring IT rest all did quite well.
But, in last week despite good performance by real estate momentum has weakened so one should remain cautious.
IT looks weak, so money may be flowing out of defensives into cyclicals - Energy and Industrials. In coming week we may see interesting action in Financials and Materials.
Since we use equal weighted methodology - therefore PSU banks and Private banks have equal weightages - therefore what we see is PSU banks are the key drivers of RS Momentum and strength improvement.
So within Banks - PSU space looks more interesting than Private banks.
Hopefully, you find this useful - please feel free to share it your friends and acquaintances and drop us the comments what you agree / disagree with.
Happy Sunday!!


